
With the sharp decline in national HCAHPS response rates over the past few years, PRC has researched response rate data trends and the relationships between reporting variables. In our published PXJ research regarding the correlation of response rates and HCAHPS dimensions scores, we found that all HCAHPS dimensions were positively correlated with survey response rate. In other words, as response rate increases, HCAHPS dimension scores rise as well.
Taking this a step further, we then examined the relationship between the HCAHPS Star Rating in comparison to response rates.
Overall Hospital Quality Stars vs. HCAHPS Star Ratings
To be clear, there are several star ratings that are applied to hospitals based on different performance criteria. The Overall Hospital Quality Star Ratings are the stars that appear next to the hospital name when searching for information on the Hospital Compare website. These star ratings consider HCAHPS scores, as well as several other quality indicators that are publicly reported on Hospital Compare. Overall Hospital Quality Star Ratings were made public with the intention to be refreshed twice a year.
HCAHPS Star Ratings are also published on the Hospital Compare website. There are 11 HCAHPS star ratings total; one for each publicly reported measure in HCAHPS (10 total) and an additional HCAHPS Summary Star Rating (average of all the HCAHPS dimension star ratings). HCAHPS Star Ratings are released quarterly. The HCAHPS Summary Star Rating is the variable we reviewed in our research.
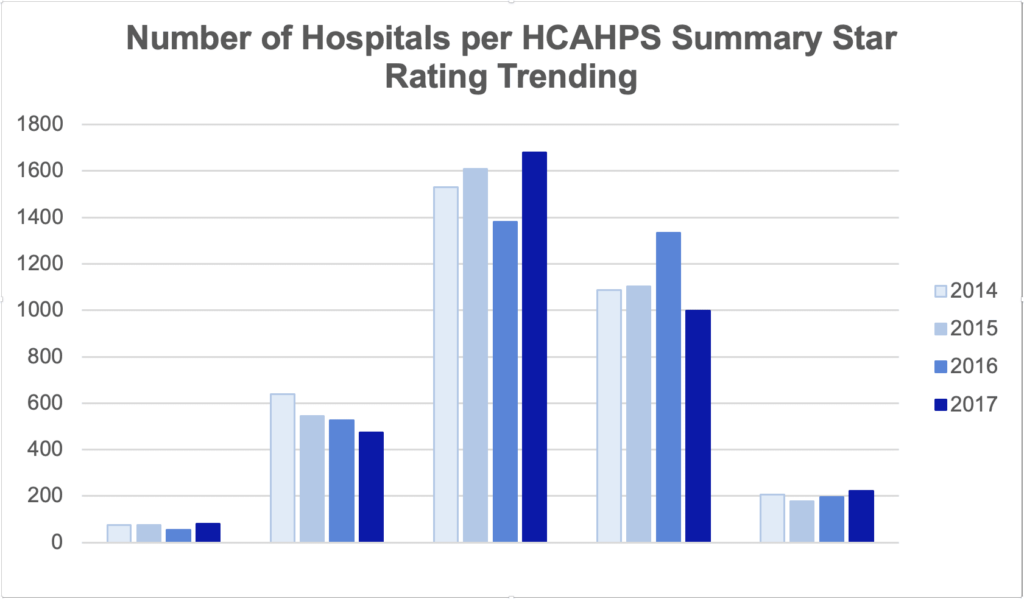
HCAHPS Star Rating Trends
When HCAHPS star ratings are broken out nationally, the trending distributions of ratings can be easily evaluated (see graph below). Over this time period, the total number of one- and five-star hospitals has remained stable, and the number of two-star hospitals has steadily decreased year over year. The noticeable shift occurred 2015-2017 between three- and four-star hospitals. For most years, the star rating follows a bell curve with the highest number of hospitals falling in the middle, three-star range. However, in 2016, the number of hospitals with a with 3- and four-star rating were relatively the same- which equated to drastically less three-star hospitals that year, and considerably more four-star hospitals. Then in 2017, the curve followed a similar distribution as years 2014-2015 and fewer hospitals earned the four-star rating and fell back into the three-star rating group.
Using both publicly reported data and our own research methods, PRC analyzed the HCAHPS Summary Star Ratings distributions compared to response rates. In the below graph, response rates for all hospitals nationally are listed across the bottom; the colored sections indicate the percentage of hospitals at each star rating.
Quickly glancing at the graph, you’ll see hospitals with a lower response rate tend to have a higher percentage of one- to three-star rating facilities, while hospitals with a higher response rate (right side of graph) are comprised of a higher percentage of four- to five-star facilities. This is similar to our findings from HCAHPS dimension scores and response rates, where we identified a positive relationship between response rates and HCAHPS dimension scores.
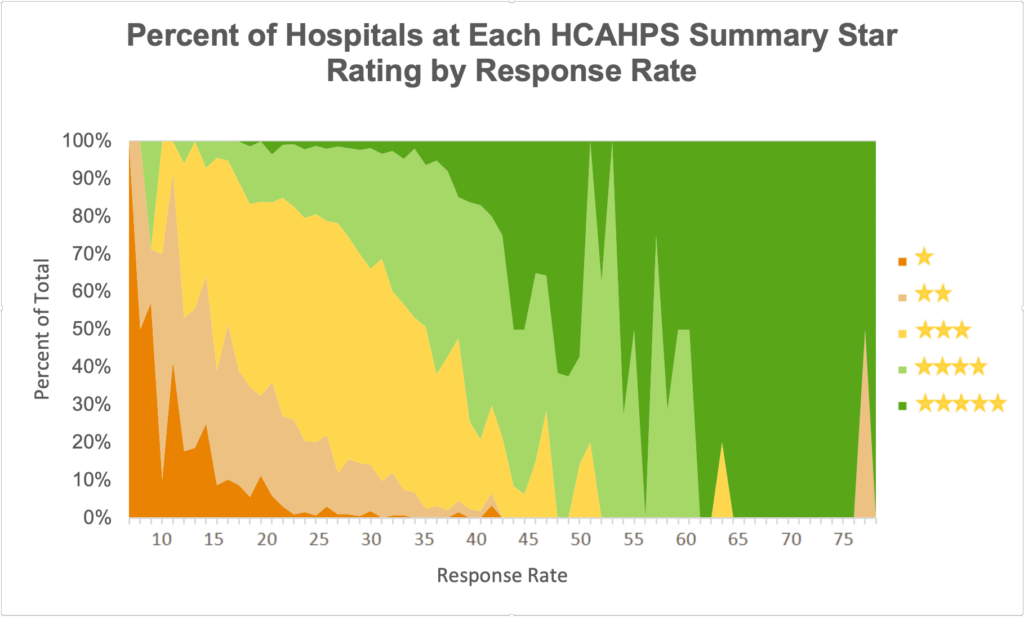
Find this surprising? We agree! When a sample is truly representative of a population, these relationships would not exist, supporting the need to maximize your response rate to fully understand your patient’s experience.
PRC has some of the highest HCAHPS response rates in the nation. If you feel like your hospital has room to improve with an optimal response rate, please reach out to our team to help develop your true potential. And don’t forget to check out our HCAHPS page for more of our research!