
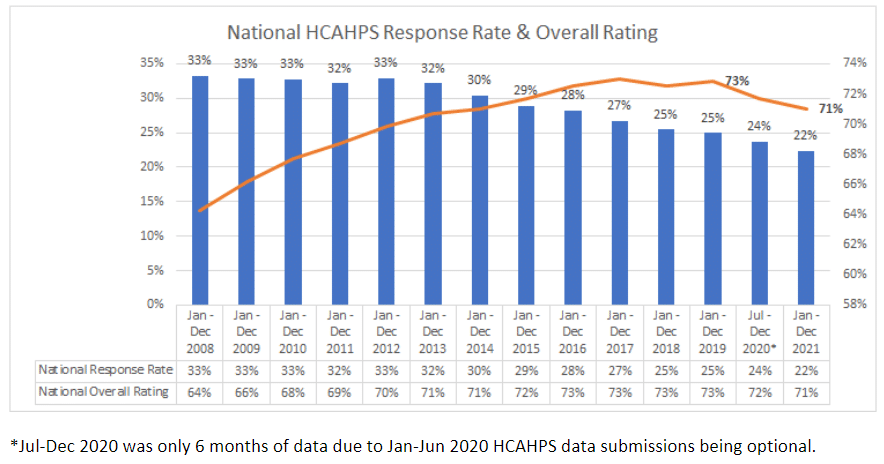
The past few years have been a roller coaster for healthcare. We now have publicly reported HCAHPS data for hospitals collected during the pandemic, where we saw that hospitals’ scores decreased during the pandemic after scores plateaued prior to the pandemic. In 2021, the average Overall Rating score fell to 71%, equivalent to the average score in 2014.
National response rates also continue to decline consistently from a high of 33% in 2012 to 22% in 2021.
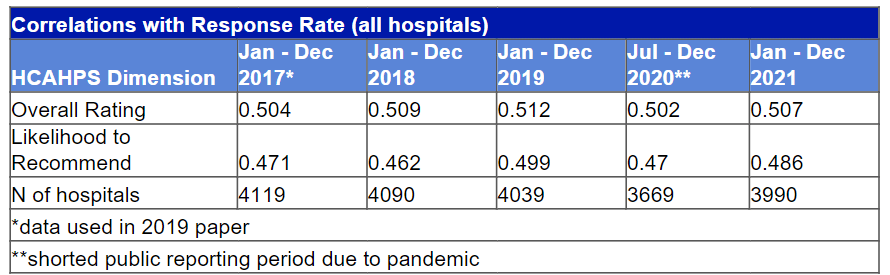
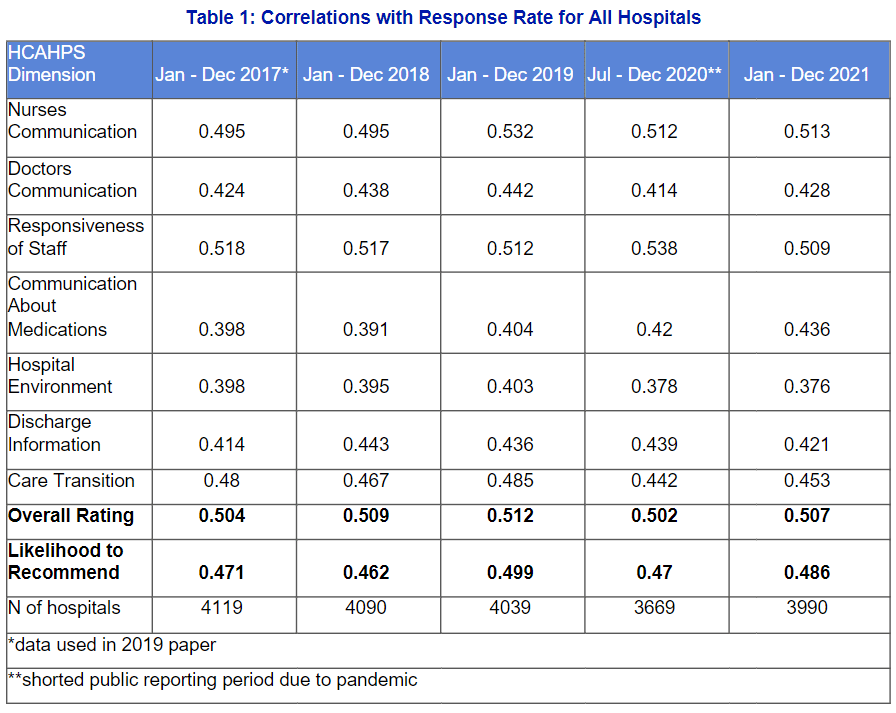
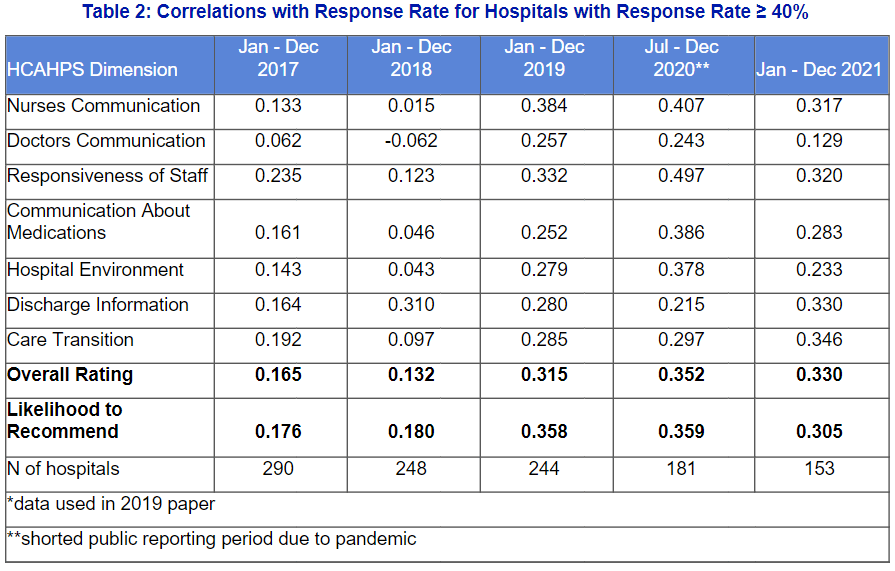
In our paper, we suggested that increased response rates would yield smaller correlations for hospitals with a response rate of 40% or more, as the data would be more representative of people who had good experiences, but were less inclined to respond to the survey. Using the 2017 publicly reported data, we saw that correlations with response rate were smaller for hospitals with response rates of at least 40% across all HCAHPS dimensions than for all hospitals. Today, we see larger correlations for this group, but still smaller than what we see for all hospitals as displayed above. (See Table 2 at the end of this document for the full HCAHPS dimension list.)
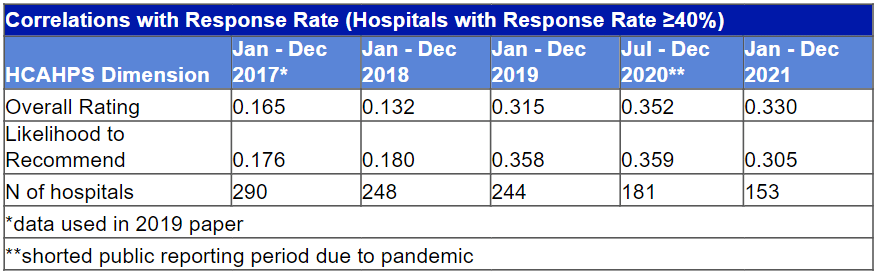
However, far fewer hospitals achieve response rates of 40% or more today, and those who do are not necessarily representative of “average” hospitals.
If we only look at acute care, non-specialty hospitals, the national response rate is only 20%. This is troubling for many reasons. According to information in CMS’ annual HCAHPS vendor introduction training, most hospitals collect data by mail, which means that this low response rate is likely biasing the data, since certain patient populations, including non-white patients, younger patients, and maternity patients, are less likely to respond by mail, which are patient demographic groups that impact hospitals’ patient-mix adjustments (which are meant to level the playing field between hospitals who serve different patients).
To address this, for 2025, CMS has proposed new mixed-mode methods of data collection which factor VBP points for hospitals based on their HCAHPS scores and how many dually-eligible Medicare and Medicaid patients a hospital serves. If approved, PRC hopes that the new survey modes would increase national response rate and improve the usefulness of the HCAHPS survey for patients to compare care between hospitals. National response rate variations make the data comparisons between hospitals less clear.
In the meantime, PRC’s average response rate for the telephone methodology is 34%, 12 points higher than the national average, and we routinely see that our phone surveys keep the data we collect representative of hospitals’ patient population overall, so you don’t have to wait until potential changes in 2025 to start getting a higher official HCAHPS response rate and more representative survey data.
Contact our CAHPS® team at [email protected] for more information.